Audiogum Service Status
An overview of how we capture service status Availability & Performance metrics and display them on a publicly accessible service status page.
Audiogum Service Status
As Steve mentioned in his High Level Architecture post, we use status.io to host our service status page. Our status page provides a summary view of our service Availability & Performance for each environment serving its customers and has become one of my favourite sites according to Chrome.
Our status page also provides additional functionality for managing incidents or maintenance notifications, storing a historical timeline of all past incidents and maintenance notifications. Feel free to have a look at our status page and subscribe to receive notifications if you’d like.
We feel a status page is an important component to service management in the traditional sense. It helps our partners and customers see how our service is performing and tallies up with what is documented in our service agreements with them.
The status page however is the last piece of quite an intricate set up. In this post, I'll try to provide some more context for the various components that make it possible for us to report our service’s Availability & Performance.
So, without further ado, let’s jump into why, what and how …
Reasoning
At the time, we were busy drafting service agreements that included defining our SLAs. This meant we needed a way of checking our public endpoints if they are available and record how long the check takes to execute, capturing these metrics for alerting and reporting.
Having something that was able to display our service KPIs only provided half the story. We needed to know when there was a deviation from the norm so not only when our availability or response times exceeded thresholds but to know if some core functionality under the hood was failing.
We also needed to be able to respond immediately if there was a service impacting issue while at the same time, able to notify all interested parties.
From an engineering perspective, we didn’t want something that would require a lot of setup, configuration and maintenance. We wanted something simple that just works and doesn’t cost a fortune!
Finally, we really wanted to avoid any manual service-level management activities. Instead, we wanted to provide our customers and partners with the means of always having this information available to them whenever they wanted it or needed to know about it.
In summary, we needed a way of monitoring our service platform Availability & Performance metrics, make them available publicly, and to be able to respond to any alerts triggered if there was a deviation from defined thresholds automatically.
Logical
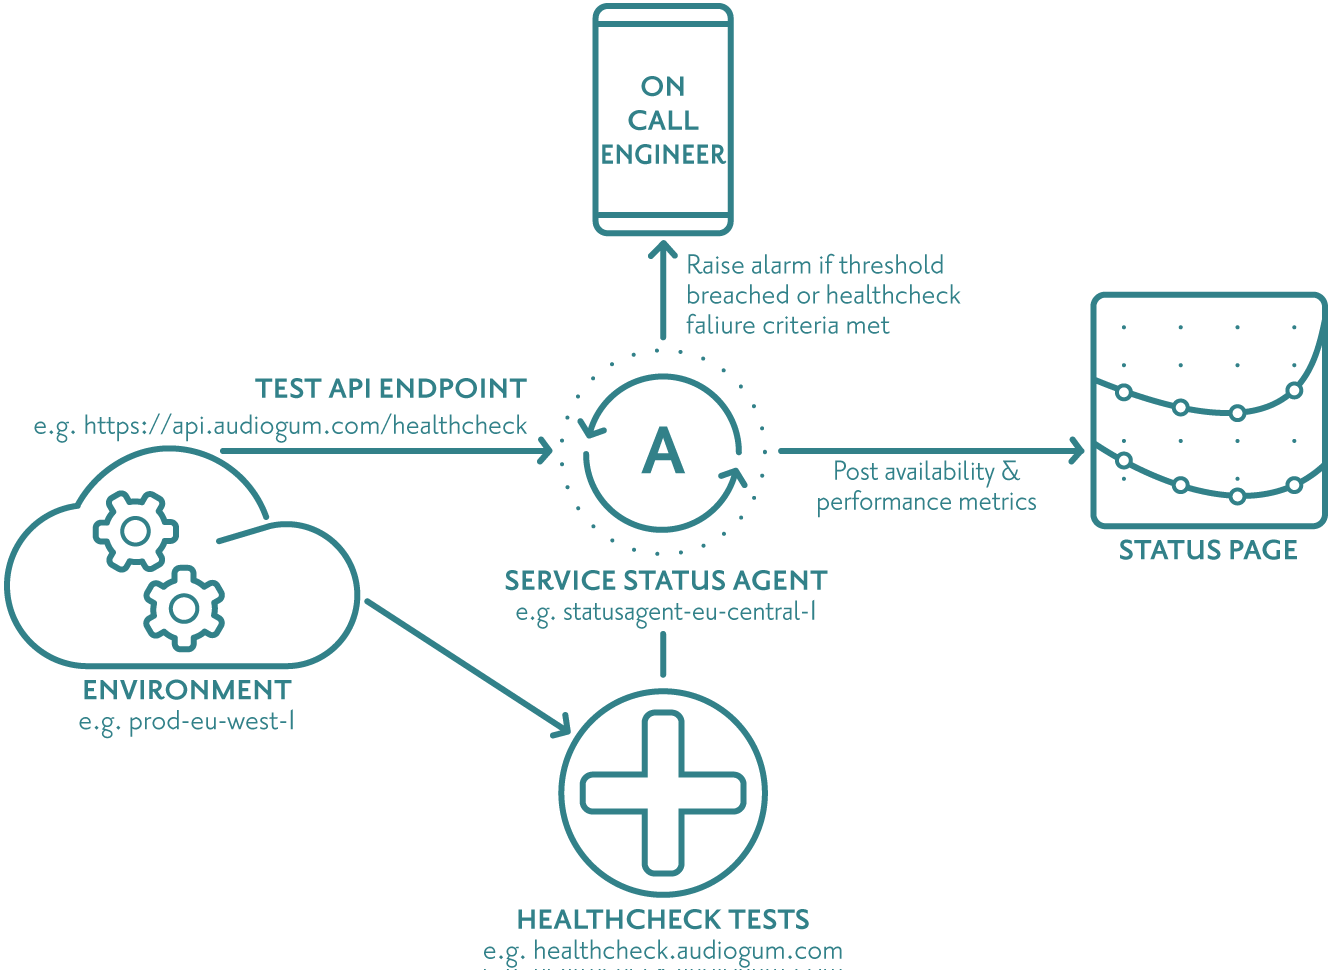
Following on from the above reasoning, we agreed we would need something like the below diagram for monitoring our service APIs, capturing Availability & Performance metrics, testing core functionality, raising the alarm to call out an engineer if needed and reporting on our service performance.
Status Agent
As you can see, we needed an agent of some kind that almost continuously makes a call to our APIs to see if they respond and how long they take to respond.
The status agent then applies some basic logic when writing the captured metrics to InfluxDB, a time series database, before posting aggregated results to our status page.
Alerting and Paging
Now that we have Availability & Performance metrics being captured, we are able to process the stream of data and alert on it if there is any trend deviation beyond agreed thresholds. In our case, we needed to know when our availability dropped below 100% and response times went above 300 milliseconds.
In order to solve this, we needed to find a way of notifying our service platform engineers any time day or night for a service impacting issue. We looked at PagerDuty, a tool we used at MixRadio, and OpsGenie automated paging services because whether you like it or not, someone has to receive that call at 2am when things stop working impacting our consumers.
On-call
I thought it would be worth sharing a brief explanation on how we have pragmatically organised on-call here at Audiogum that makes sense for our ways of working. In my past experiences, this has always been a tricky subject to broach as nobody wants to sign up to being on standby out of hours.
What seems to work very well for us is, we have X number of engineers who are part of the on-call schedule. Weekly on-call rotas are set up for the year so each engineer is on call for one in X weeks and knows which weeks during the year they are on-call. The on-call rota week is from Monday 09:00:00 to the following week Monday 08:59:59. This enables us to be flexible and are always able to cover for each other if needed with a little planning.
We have an escalation policy defined just in case the on-call engineer isn’t able to respond to the call out and the next rotation on-call engineer will then receive the page. If they aren’t able to respond, the entire team then gets paged and it is the first to respond who acknowledges the call.
For the holiday seasons where we have reduced numbers, we have a call out policy in place that simply pages the entire team and it is the first to respond who acknowledges the call.
The role of the on-call engineer is to (in no particular order):
- Receive the page and carry out a basic triage function to ascertain the level of service impact.
- Try to resolve any issues and restore service if they can.
- Coordinating the incident and sending out incident notifications.
- Call anyone needed to assist in restoring service.
- Keep everyone updated in our #engineering-alerts Slack channel.
In most cases though, you will find fellow team members online and available to assist in resolving any issues.
To help make the on-call engineer’s job easier, we have compiled some handy troubleshooting guides and useful information. This is designed to be easily digestible in the event of a call out occurring at those bleary eyed, dark and unsocial times of the morning when the ability to think clearly can be a bit of a luxury.
To give you an idea of the sort of thing you’ll find:
- On-call notification checklist, an easy to read flowchart on how to handle receiving a page.

- How to investigate availability drops on our status page.
- Kubernetes diagnostics and node rolling.
- Etcd diagnostics.
- VPN connectivity troubleshooting.
- Useful links such as our API explorer, Healthcheck, Kibana, Grafana, etc.
Healthcheck
At this point, we had conceptually come up with a way of simply monitoring our service providing our Availability & Performance KPIs, automated paging an engineer and providing us with the means of notifying our partners and customers in the event of a service impacting issue.
Internally we also wanted to know if any core functionality wasn’t working correctly so needed a way of testing the underlying core functionality of our service platform and alert us if something wasn’t right.
Status Page
After trialling a couple of status page providers, decided on using status.io as a way of hosting a status page independently of our environments but more on this topic later on.
Implementation
For each regional deployment or environment serving customers, we have a status agent and healthcheck implemented to monitor it and keep us posted with anything untoward that’s impacting our customers. Currently we have two status agent’s and health checks. One is hosted in eu-central-1 (Frankfurt) monitoring our staging and production environments hosted in eu-west-1 (Dublin) and the other monitoring our production environment in cn-north-1 (Beijing).
Status Agent
The status agent is made up of a bunch of python scripts that:
- Captures metrics every five seconds and writes them to InfluxDB.
- Queries InfluxDB averaging the Availability & Performance metrics by minute, hour and day for the last 30 days and posts the results to status.io every one minute.
The logic implemented using python scripts to capture Availability & Performance metrics is as follows:
uri = 'https://api.audiogum.com/healthcheck'

if status_io(maintenance_flag) == false:
    if response(uri) == 200:
       availability = 100%
    else:
       availability = 0%
    response_in_milliseconds = time_taken(response)
else:
    sleep 60 # sleep for a minute while maintenance is underway
It is worth calling out that there are a number of factors to consider when trying to ascertain if a failed response is indeed an issue with the service or if it is due to normal internet turbulence. In our case, depending on the type of exception raised we wait a minute and retry the request and it is only upon three consecutive failures before a failure is logged and an alarm triggered.
Alerting
We use another of influxdata’s open source products called kapacitor for raising the alarm when needed. Kapacitor integrates with Slack and OpsGenie so we receive any alerts raised instantly notified to the on-call engineer.
Healthcheck
The healthcheck is a Jenkins job that runs a cut down version of our automated tests recording a success or failure healthcheck record to InfluxDB every three minutes.
A healthcheck kapacitor alert is then configured to raise the alarm when needed giving us alerting and on-call notifications for any core functionality that might be failing.
Automated Paging
There’s some basic setup required in order to trigger OpsGenie to call out an engineer including:
- User profiles. Each engineer creates a user profile where they define how they can be contacted and what their escalation rules are. Here is what I have set up for myself.

- Teams. Set up your teams, in our case we have configured a single team called Platform.
- On-call schedules. As already mentioned, we have defined a weekly rotation. Once defined, associate the schedule with the appropriate team.
- Escalation policies. This is configuring the rules on what to do if the on-call engineer doesn’t respond or acknowledge a call out. To give you an idea, here is is what we have configured for our Platform team escalation.

Status Page
With status.io, there is also a bit of configuration and design required before being able to publish your metrics including:
- Containers. In our case, we use containers to define our environments.

- Components. In our case, we have two public endpoints, api.audiogum.com (API) and www.audiogum.com (WEB). Here you also specify which component is available in which container..

- Metrics. Here we configured which metrics we wanted to capture and display on our status page, what the min and max display values are, etc. and is also where the specific metric ID is made available that’s used when posting metrics to status.io.

- Design. This is where we customised our status page and the end result can be seen here.
Summary
There you have it, that’s how we have implemented Automated Service Management that includes, service status & healthcheck monitoring, alerting in the event of something going wrong, on-call engineer paging any time day or night and a publicly available service status page that all just works.
We have found this set up to be invaluable in keeping an eye on our service health and reliably notifying us in the event of something not working as it should. It did take a little bit of tuning to get the alarm thresholds right so that we didn't unnecessarily get anyone out of bed for a false alarm but once the initial tweaks and adjustments were made, it has run without much operational overhead ever since :)