Analytics at Audiogum
Or, how we turn 10s of millions of monthly data points into consumable analytics.
Introduction
Audiogum has been going for some two and a half years now and our analytics platform currently serves up a multitude of data, cut in many different ways for any partners that integrate with us. From active user data, user retention and cohorts, user and device registrations to user listening habits, 3rd-party music service sign-ons and app navigation analytics, to voice/utterance analytics, firmware uptake, to realtime graphing of user activity, the data is available to partners in its raw form, it can be exported to services like Elasticsearch, made available as graphs on partner-specific dashboards or via email, cut by country, region, date, time, device type, client, music genre, audio source, and more. Pretty much any way a partner could want to see it.
Each partner's data is ring-fenced from all other partners’ data. As Audiogum, we can see all the data unsegregated, giving us a "platform's eye" view on everything. This means we can spot trends and issues and offer insights, further enhancing our partners' understanding of their products, apps and customers and helping improve their implementations.
So what's the architecture? How did we get here? As with many things in an agile-centric organisation, one step at a time...
A Brief History
In the beginning... 2016
Back in 2016, we'd created a platform hosted in AWS' Ireland campus, capable of hosting user and device data and while we iterated on that to bring the features we'd envisaged, we decided to start work on our analytics offering. We started by targeting the user and device account data that had been registered with us and creating an event stream that we could generate events for internally and allow partners’ apps and devices to send events to as well.
Using this architecture and data, we were able to provide metrics to partners detailing user and device registrations geographically and over time. Also, as a startup, one of the obvious metrics we'd want to track for our partners was Active Users. Much has been written on the importance of tracking these metrics, whether from a standpoint of looking for investment or just checking the overall health of the business. We also use it as one of the possible measurements by which we can charge integrating partners.
2017
In 2017 we provisioned a second cluster in China. This was necessary to legally provide a service there. We also needed to address the poor performance encountered sending traffic across the so-called "Great Firewall of China". In parallel, we implemented a stack of features around content consumption. At this point, we extended the events that could be sent into our stream and set up replication of non-sensitive event data between China and EU. This ensured we complied with the upcoming GDPR and allowed us to report on the "whole world" for our clients (rather than serving them separate reports for China and the Rest of the World) and developed more dashboards for our partners visualising retention and user cohorts as well as cutting AU metrics by client, country and region.
2018
In 2018 we added a data warehouse - Amazon's Redshift. This allowed us to easily store history and cut down on the amount of re-processing that occurred every month to calculate things like cohort activity. It also allowed us to integrate sophisticated visualisation software (we chose Periscope Data), making the presentation of understandable metrics much easier. It also made it easy to implement real-time metrics due to the connectedness of many of the AWS services. With all our account and event data in a queryable SQL-based backend, it's very easy for anyone in the business to get at the data they need and to create new reports and dashboards quickly.
Getting the data into the Warehouse
Data needs to be extracted from multiple sources and transformed into structured data before being loaded into the data warehouse. The details of the architecture behind this are shown below.
EXTRACT
We currently use two main sources of data:
DynamoDB
We use AWS DynamoDB as one of our platform's main data stores. Examples of data we store there that we currently use for reporting are:
- User accounts - data around when the account was created, what country the user is registered in, ...
- Device state - data around when the device was registered on our platform, country of use, firmware version, current owner, ...
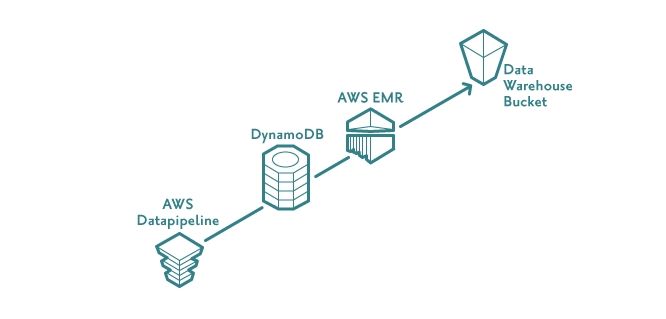
Every day we dump data from DynamoDB to S3. This is done using AWS Data Pipeline, which has various pre-canned pipeline templates, including one called “Export DynamoDB table to S3”. Although it can be a pain to configure, Data Pipeline simplifies several things. It lets us:
- Raise an EMR cluster on a daily schedule to read the data from DynamoDB and write it to S3.
- Set what percentage of the Dynamo table's read capacity should be used (allowing us to ensure taking the data dump doesn't interfere with business-as-usual traffic).
- Configure what should happen in the event of an error (if the pipeline encounters a problem, we send a message to AWS Simple Notification Service (SNS) which we have integrated with our team's Slack account, meaning the team will see the problem as soon as it happens via a Slack notification).
- Define the order in which processes occur (we don't want to start processing data for a partner's CRM run before we have all the necessary data available for example).
Event Stream
We have an event stream that apps, devices and our own platform send events to. Some of the main event types we report on are:
- Token Request events - our platform produces these in response to client requests for the tokens that mediate access to our platform.
- Play events - apps and devices can send us events detailing user interactions with a music player (music source, play, stop, skip, seconds listened).
- Navigation events - apps can send us events detailing how users navigate around them (which options were selected, how long did users stay on one screen).
- Music Service Auth events - our platform produces these when a user logs-in to a 3rd-party music service (eg Tidal, Deezer) through our platform.
- Voice Feedback events - our platform produces these events when users interact via voice and they detail what was said, how we interpreted it and how we responded.
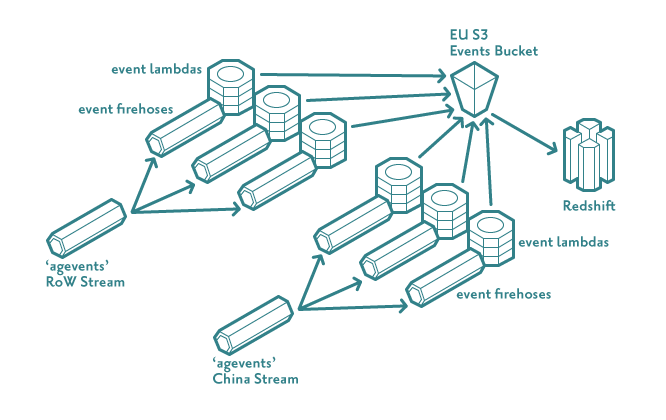
The basic architecture behind the consumption of our event stream is pictured below:
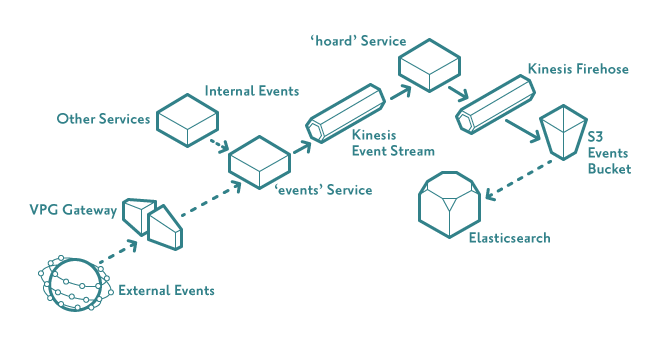
Within our platform we have three microservices that help orchestrate the process: events, hoard and syncomatic.
- The events service has a REST API that allows JSON-structured event data to be POSTed in. This can be done from external devices (companion apps, speakers, watches, ...) that are authorised via client keys and secrets or from other services in our platform in response to certain occurrences (creating a new user, registering a new device, requesting an access token, etc). The service schema-checks the data sent in to ensure it has the expected structure, typing and values and then sends it on to AWS Kinesis Streams (a real-time data streaming service).
- The hoard service is primarily responsible for consuming and persisting the kinesis stream. It uses AWS Kinesis Firehose (a service for loading streaming data into data stores and analytics tools) to read the kinesis stream and writes to firehose using AWS-supplied client libraries. We configured firehose to write to S3 (our persistent store) and elasticsearch (allowing us to view incoming events in real-time and perform basic analytics for troubleshooting purposes). When we deployed our cluster in China, we had more work to do as Kinesis Firehose was not available there. This meant we had to develop something that would buffer the events in the hoard service and write them to S3 in the same way as Firehose would outside of China.
- A final part of the puzzle was the GDPR-compliant syncing of data between the China and European clusters. As GDPR forbids us from moving PII data from Europe to China, it added weight to our decision to centralise our data in the EU cluster for analytics purposes. Although AWS allows transfer of data between different accounts and regions, the China AWS region is within a separate AWS partition and Amazon's S3 replication features are not supported between different AWS partitions. Using S3 Event Notifications we send messages to AWS Simple Queue Service (SQS) whenever a file is created in S3 by hoard in China. Another service called syncomatic reads these notifications and, on detecting a new file has been written, it will read the file from the Chinese S3 bucket and write it to a bucket in the European one. This results in all of our event data residing in 2 buckets in our European S3 (one for China, one for the rest of the world).
AWS Cloudwatch allows us to monitor specific metrics and send notifications to our Slack account (as above) if, for example, data throughput sinks below a certain level, keeping the team notified of any issues in the stack.
Having all our account and event data in a single account's S3 is the starting point for all our analytics.
TRANSFORM
Although we now have all our data in one place, it is in different formats:
Data exported from DynamoDB using Data Pipeline/EMR is in a JSON format, but values in the schema are made up of a datatype "key" and the actual value as a map entry.
eg
{
  "videos": [
    {
      "file": {
        "S": "file1.json"
      },
      "id": {
        "N": 1
      },
      "ready": {
        "bOOL": true
      }
    }
  ]
}
Kinesis Firehose on the other hand writes data to S3 as files of JSON-lines (one line per json object).
{"clientid": "someid", "countrycode": "gb", "deviceid": "abcd", ...}
{"clientid": "otherid", "countrycode": "dk", "deviceid": "efgh", ...}
Our end-goal is to convert it all to structured data so it can be stored in our data warehouse. To achieve this, a simple clojure application was written (ag-warehouse) that transforms the data as detailed below. Once again we use Data Pipeline to raise an EMR cluster and SNS notifications to Slack to orchestrate and monitor the process.
DynamoDB Extracts
The application takes the following steps:
For each type of data it
- Works out the latest S3 dump directory to find the most recent dump.
- Gets a list of all the S3 data file keys for the dump files.
For each file key, it then:
- Copies the file from S3 to the master node of the EMR cluster.
- Uses clojure's cheshire library to convert the JSON data to the extensible data notation (EDN) format that clojure's Reader supports.
- Extracts and processes the fields we are interested in and appends them to a file in a structured, pipe-delimited format.
- Deletes the local file that was copied from S3.
Once all the S3 JSON files have been converted into a single pipe-delimited file, that file is written back to a "data warehousing" bucket in our EU S3 account.
Events Data
At this point, our events data is stored in two S3 buckets (China and "Rest of World") under directory structures that looks like this:
YYYY/
    MM/
      DD/
         data files
This structure is very convenient for use as the data backend of the Apache hive database that runs on EMR and simplifies some things:
- Using hive you can create an EXTERNAL TABLE over an S3 location. So, for example, if you created a table over the YYYY directory, all data in all subdirectories will be available as a unified data store for querying. If you only want to query a single day, you can create the
table over the DD subdirectory. This means you can point the same hive queries at different cuts of data. - Apache hive has some good built-in "Table-Generating Functions" such as LATERAL VIEW which allows us to easily parse JSON-lines into structured data.
- It also has the usual raft of SQL functions you'd expect, allowing for whatever normalisation we need to apply.
Essentially, we:
- Create an EXTERNAL TABLE over each of the specific cuts of data we want in the European and Chinese events S3 buckets.
- Create another EXTERNAL TABLE over our data warehousing S3 bucket (where we store our structured data, ready for loading into the data warehouse).
- Run an INSERT query which extracts data from the events tables and writes the transformed, unified data to the warehousing bucket.
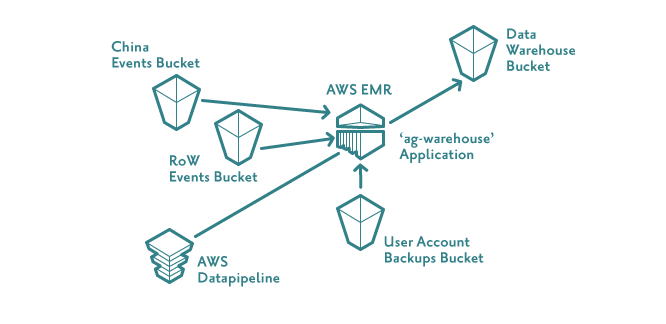
We now have all the data we want as structured data in different subdirectories in the same data warehousing S3 bucket.
LOAD
For our data warehouse we use Amazon Redshift, which we have provisioned via terraform inside our VPC. The Redshift query syntax is based on PostgreSQL but as it's designed for OLAP/BI applications, it's backend has been implemented as a columnar store rather than using a relational DB model. This gives us the ease-of-use of a structured query language combined with the analytical power of a columnar store. Redshift has many useful features (automated snapshots, workload management, VPC routing, easy scalability to name a few) and loading data into it from S3 is very straightforward. A single command specifying the S3 source directory, the target table and some options specifying how it should handle certain types of data (NULLs, date and time formats, column truncation, max errors before the load will get cancelled are all options we make use of) will quickly result in queryable data
eg:
COPY <destination schema>.<destination table>
FROM 's3://path/to/s3/data/'
DELIMITER '\001'
NULL AS '\\N'
TIMEFORMAT 'auto'
TRUNCATECOLUMNS
MAXERROR 5
IAM_ROLE 'AWS IAM ROLE ARN'
REGION 'eu-west-1';
So, by issuing one command for each data type we want to store, all our data is ready for analytics and reporting.
In short, we have a robust, secure, scalable and fault-tolerant distributed ETL, scheduled and monitored with alerting in the event of problems.
With the data in the data warehouse, it is easy to implement data-collections for reporting purposes. There is an ecosystem of visualisation and dashboarding tools that can sit on top of Redshift. We chose Periscope Data, which allows us to very quickly build dashboards and share them via web links, emails and embedded images in web pages.
Realtime
Once the above was implemented, we noticed that AWS had provisioned the use of lambdas in Kinesis Firehose to allow for the transformation of incoming source data. Essentially, using this model, Firehose buffers incoming source data and applies the specified lambda function asynchronously to each buffered batch. The transformed data is sent back to Firehose for delivery to its designated destination (buffering in S3 for endpoints such as redshift and elasticsearch).
We decided to write lambdas for each event stream that would transform the incoming event data in the same way that our 'ag-warehouse' application did. This was achieved using uswitch's lambada project which makes writing lambdas for AWS in Clojure very simple.
Using terraform, we created transformational firehoses for each event type and connected them to each of the Kinesis Streams we had (China and RoW). These firehoses read the incoming event data, transformed them appropriately according to the event type, buffered them in S3 and then finally wrote the data to Redshift.
Appropriate real-time visualisations were then created over the top of this data (so-far-today metrics like "tracks started", "Hourly AU", "Hours Listened"), allowing for real-time feedback on the effects of changes made to the system, campaigns being run by partners and the introduction of new features.
Tech Stack
As we’ve related above, our solution has evolved over time and will continue to as we implement new features in our platform and our partners bring new requirements. Here’s a brief summary of the services and software that make up our current stack as described in this post:
Data Stores
- DynamoDB
- S3
- Redshift
Orchestration
- AWS Data Pipeline
- Kinesis Streams
- Kinesis Firehose
- S3 Event Notifications
- Simple Queue Service
- AWS VPC
- Terraform
Processing
- EMR
- Lambda
- Clojure Microservices
- Apache hive
Monitoring
- AWS Cloudwatch
- Simple Notification Service
- Kibana
- Fluentd
- Elasticsearch
- Slack
Visualisation
- Periscope Data
- Kibana
In Conclusion
With this setup, it's now very easy to integrate new data sources (e.g. web scraping, ip lookup data sets, etc), set up new reporting collections and dashboards, control the dissemination of the data, stay GDPR compliant and be confident in the security provided by having our deployments isolated from the internet via the AWS VPC model.